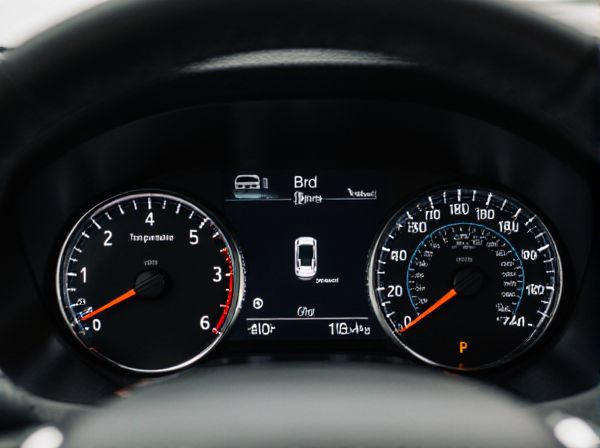
Photo illustration: Needle Temperature Gauge vs Bar Graph Temperature Gauge
Needle temperature gauges provide precise readings with a moving needle that points directly to the temperature value on a dial, making it easy to monitor changes at a glance. Bar graph temperature gauges display temperatures using a series of illuminated bars that increase or decrease to represent the current temperature, offering a quick visual assessment of heat levels. When choosing between the two, consider your need for exact temperature data versus a simple, easy-to-read display to suit your monitoring preferences.
Table of Comparison
| Feature | Needle Temperature Gauge | Bar Graph Temperature Gauge |
|---|---|---|
| Display Type | Analog needle | Digital bar graph |
| Readability | Instant glance, precise pointer | Visual gradient, easy trend spotting |
| Temperature Range | Fixed scale with marked zones | Dynamic bar levels, color-coded |
| Response Time | Immediate needle movement | Smooth incremental bar changes |
| Driver Feedback | Clear overheat alert via needle position | Color shifts indicate temperature rise |
| Preferred Use | Traditional cars, precise monitoring | Modern dashboards, trend visualization |
| Maintenance | Requires calibration and mechanical upkeep | Minimal maintenance, electronic display |
Introduction to Temperature Gauges
Temperature gauges are essential tools used to monitor and measure heat levels in various industrial and automotive applications, ensuring optimal performance and safety. Needle temperature gauges provide precise analog readings through a dial and pointer mechanism, making them ideal for quick visual assessments. Bar graph temperature gauges display temperature levels as segmented bars, offering a clear, intuitive representation of gradual temperature changes for easier trend analysis.
Overview: Needle vs Bar Graph Gauges
Needle temperature gauges feature a dial with a moving pointer that provides precise temperature readings through analog display, ideal for quick visual reference. Bar graph temperature gauges use LED or LCD segments to indicate temperature levels, offering an immediate, segmented visual representation of temperature trends. Both types serve essential roles in monitoring temperature, with needle gauges excelling in accuracy and bar graph gauges enhancing readability and rapid status assessment.
Design and Display Differences
Needle temperature gauges feature an analog dial with a rotating needle that provides precise, real-time temperature readings, offering a classic, easy-to-read circular scale design. Bar graph temperature gauges display temperature through segmented bars that illuminate progressively to indicate temperature levels, providing a modern, linear visual representation ideal for quick status assessments. The needle gauge excels in detailed, exact readings, while the bar graph gauge emphasizes immediate visual trends and simplicity in monitoring temperature changes.
Accuracy and Precision Comparison
Needle temperature gauges offer high precision with a fine pointer that allows for exact readings, making them ideal for applications requiring detailed monitoring. Bar graph temperature gauges provide rapid visual feedback with segmented displays, but their accuracy is generally lower due to broader increments and less granular data representation. When comparing accuracy, needle gauges typically outperform bar graph gauges because their analog scale enables more precise temperature differentiation.
Real-Time Response and Readability
Needle temperature gauges provide precise, real-time response through a moving pointer that visually tracks temperature changes instantly, offering high accuracy in dynamic settings. Bar graph temperature gauges enhance readability by displaying temperature levels as segmented bars, allowing users to quickly assess ranges at a glance, especially in environments requiring rapid interpretation. Comparing both, needle gauges excel in fine detail monitoring, while bar graph gauges prioritize quick, intuitive readings.
Durability and Reliability in Various Conditions
Needle Temperature Gauges offer high durability due to their mechanical construction, making them reliable in extreme temperatures, vibrations, and harsh environments. Bar Graph Temperature Gauges provide precise, real-time visual feedback with robust sensors but may have reduced longevity in rugged or high-impact settings compared to needle gauges. Both types maintain consistent accuracy, but needle gauges excel in long-term reliability under severe operational conditions.
User Experience and Ease of Interpretation
Needle temperature gauges provide precise, real-time readings with a clear pointer indicating exact temperature levels, enhancing accuracy for users needing detailed monitoring. Bar graph temperature gauges offer an intuitive visual representation with segmented color zones, making it easier for users to quickly assess temperature ranges at a glance. Users seeking detailed data may prefer needle gauges, while those prioritizing rapid interpretation often find bar graph gauges more user-friendly.
Cost and Maintenance Considerations
Needle temperature gauges typically have lower upfront costs and simpler mechanical construction, making them more affordable and easier to maintain compared to bar graph temperature gauges. Bar graph temperature gauges often involve advanced electronics and sensors, which increase both initial investment and potential maintenance complexity. Maintenance for needle gauges usually involves occasional calibration and mechanical inspection, while bar graph gauges may require software updates and electronic component replacements, impacting long-term operational expenses.
Applications and Industry Preferences
Needle temperature gauges are widely utilized in industrial applications requiring precise analog readings, such as HVAC systems and automotive engines, due to their quick response and durability. Bar graph temperature gauges are preferred in manufacturing and process control environments where visual trend monitoring and digital integration are critical for performance optimization. Industries favor needle gauges for straightforward mechanical systems while choosing bar graph gauges for advanced digital interfaces and data visualization needs.
Choosing the Right Temperature Gauge for Your Needs
Needle temperature gauges provide precise analog readings ideal for applications requiring accurate temperature monitoring, while bar graph temperature gauges offer quick visual feedback with segmented displays suited for monitoring trends and ranges. Choosing the right temperature gauge depends on your need for accuracy versus ease of interpretation, environmental conditions, and whether you prefer a traditional dial or a modern digital interface. Consider factors such as response time, durability, and compatibility with your system to ensure optimal performance and reliability in your specific application.